Making the most of BirdTrack data locally
Developing informative summaries for bird reports
We have been working to produce useful summaries for bird reports using data from the millions of annual BirdTrack records.
Every year, thousands of birdwatchers submit millions of individual records to BirdTrack, and the following year, many county recorders and bird report editors across the UK use them to start writing their county bird report. It’s a big job: verifying and integrating records from a growing number of sources, dealing with different taxonomies, assessing rarity descriptions, standardising site names and many other tasks that need to happen before we birders get to lay our hands on the report.
In all that work it is no surprise that the huge volume of BirdTrack records can sometimes seem daunting. Take a county like Cambridgeshire: in 2020, over 400 BirdTrack users submitted over 200,000 records. A critic might argue that with only half of these records including the number of birds seen, and less than one in ten including breeding evidence, the information content of the data might appear low. But looking at the data as individual records ignores one of BirdTrack’s strengths: in this case 84% of these records came from Complete Lists – where BirdTrack users have said they noted down all the bird species they detected, not just their highlights. This small but crucial detail tells us not only about what was seen or heard, but also the species that were absent or not detected.
Over recent months we have been working with selected county recorders and report editors to develop summarised ‘data products’ which make better use of those hundreds of thousands of records. The aim is that, like for the BTO/JNCC/RSPB Breeding Bird Survey, where bird reports include derived information (e.g. population trends) rather than the individual bird records, we will supply bird report editors with a selection of derived metrics, tables, graphs and maps, all based on BirdTrack data from their county. In this context, it matters less that BirdTrack does not count every last Whinchat or Whitethroat, but that it provides standardised outputs that offer insights into the status of birds in a county or region. Below are a few examples of the kinds of outputs we have been developing.
Maps of recording effort
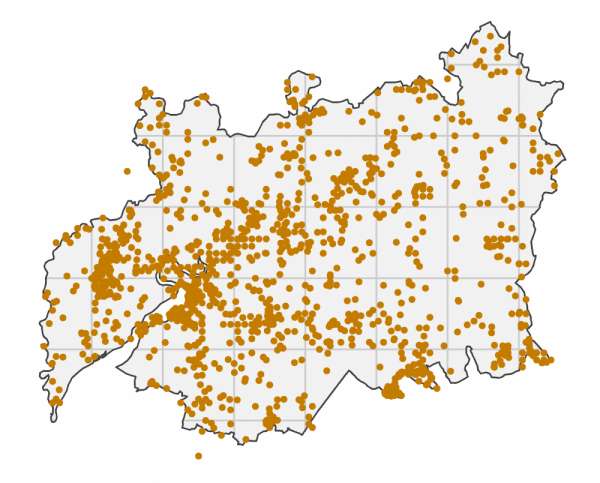
Before looking at the bird species it is important to understand where and when the data were collected – so we are developing maps of where BirdTrack users went birding. These maps also show the parts of the county that received very little attention: perhaps these underwatched corners of the county could be targets for next year’s explorations?
Seasonality of recording effort
The number of Complete Lists submitted per week is a good indication of how recording effort varies through the year. 2020 was an unusual year, with periods of lockdown and limited access to the countryside. Even so, in the example below there were over 100 Complete Lists in every week, meaning plenty of data for analysing the arrival and departure timings of migrants.

Seasonality of records
Many bird reports will contain information on when the first or last of a species was seen in the county. But what about in between those dates? The graph below shows all the dates on which Green Sandpipers were detected in Suffolk in 2020, with a scattering of records through the winter, a noticeable run of records in April, then seemingly none in May before the return of birds from mid-June onwards. The problem, of course, with a summary like this is that we do not know if some people simply stopped reporting Green Sandpipers after they saw their first ones in spring. This is where Complete Lists come to the fore, as the ‘complete’ tag means we know that if someone saw a Green Sandpiper, they would have reported it.

Reporting Rates through the year
Complete Lists give us the crucial information of not just what a birder saw, but also what they did not see during their session. Aggregating all the Complete Lists together allows us to calculate ‘Reporting Rates’ which indicate the percentage of occasions on which a species was detected. Provided there are sufficient Complete Lists in a week we can summarise reporting rates on a weekly basis, as here for Green Sandpiper in Suffolk. The seasonal pattern is similar to the number of records above, but because it is based on Complete Lists we can be confident it is not biased by observers only reporting their first sighting of the year.

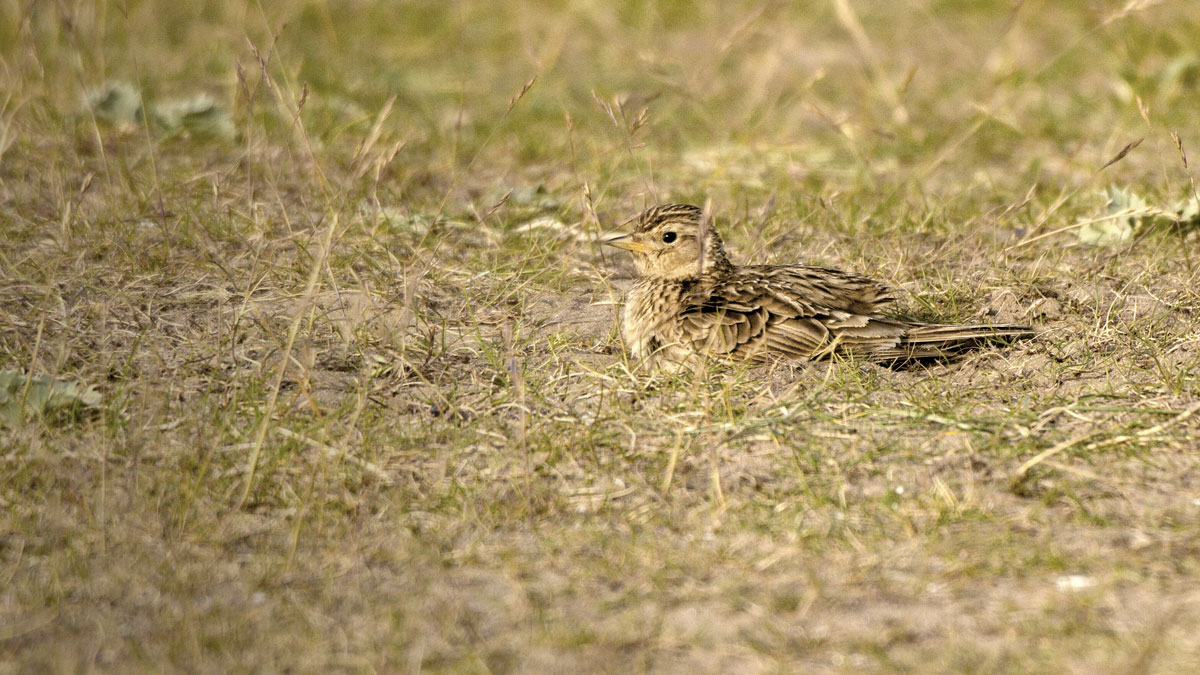
Sometimes reporting rate graphs reveal interesting behavioural patterns as well as migration pulses. The example below for Skylark shows that in the first week of January, fewer than 5% of Complete Lists included this species. The reporting rate rises through spring to peak when song activity is at its greatest before dwindling to near zero, presumably as birds are less detectable during post-breeding moult. We then see a second increase as birds begin migration. Until now most bird reports have lacked this sort of detail.

Complete Lists are great, but what about those species that are just so scarce that they rarely find their way onto a Complete List? The example below for Whinchat shows reporting rates in dark blue for the weeks when birders were fortunate enough to detect them during their Complete Lists (peaking at 7% in the first week of September). The pale blue bars show all the weeks when Whinchats were recorded as Casual Records, showing the wider period in spring when Whinchats were present but just not captured by Complete Lists.

Species maps
Ideally we would use BirdTrack data to map the distribution of species but this isn’t straightforward. Firstly, not every part of a county is visited in every season, so gaps in maps might be due to under-recording. Secondly, our birding sites rarely fit neatly into grid squares. The map below shows in grey background the parts of the county that were visited at least once in the year, and the superimposed dots show the sites where Eider was recorded at any time in the year.
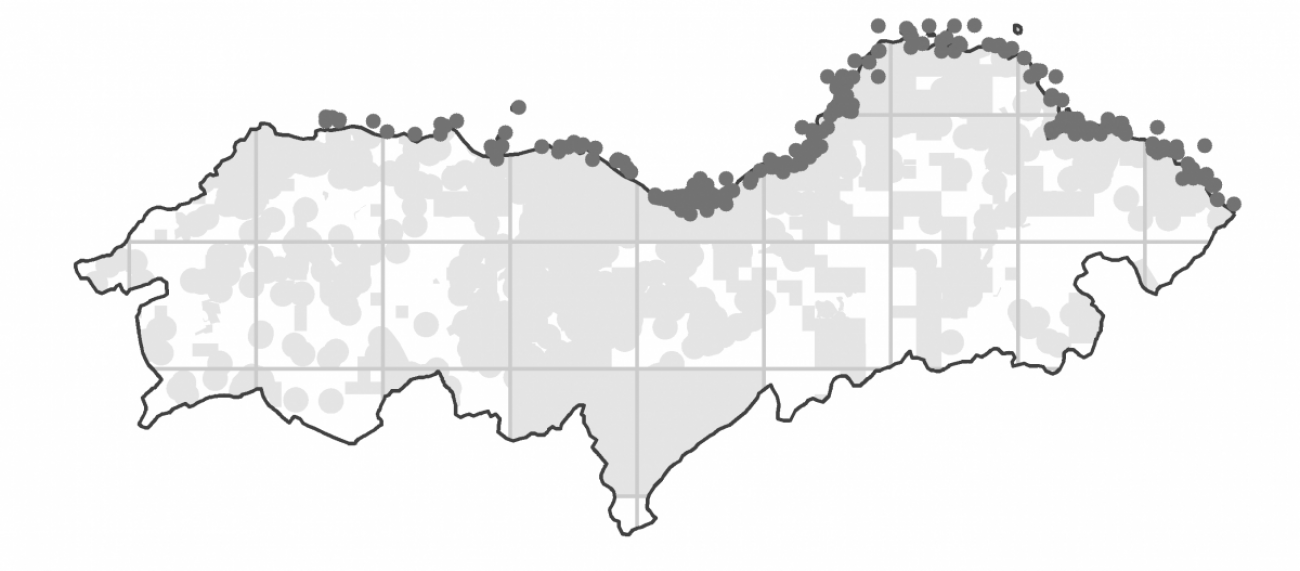
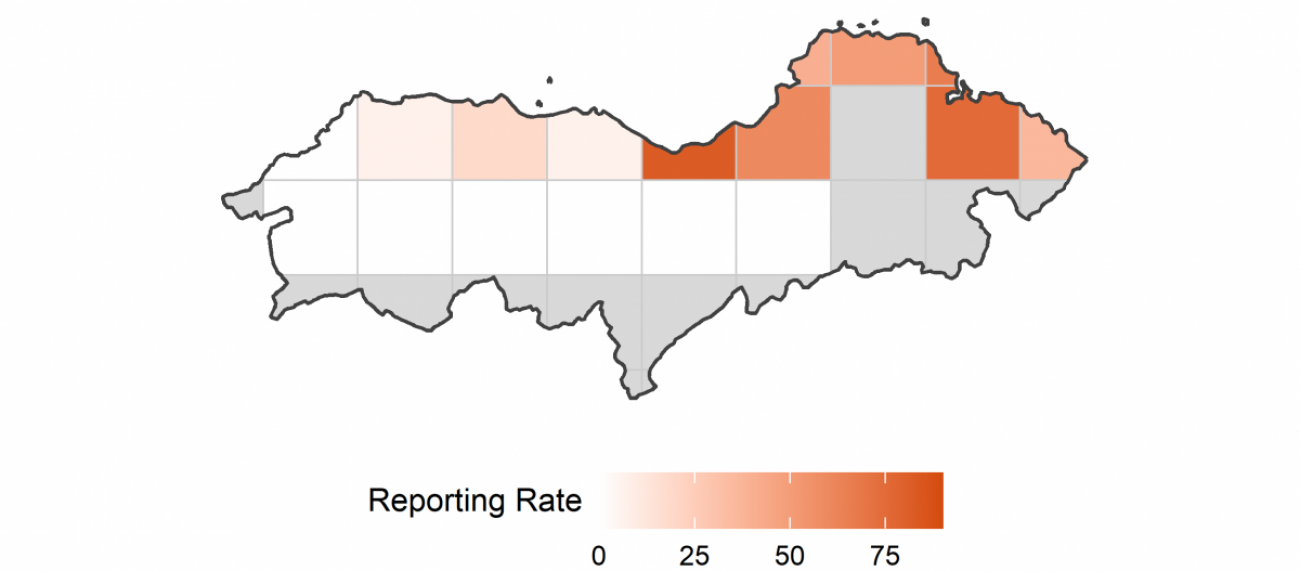
As with the graph of records, a map like this can be misleading because different areas will have had different amounts of recording effort through the year. One way to overcome that is to map reporting rates. We are still experimenting with the best way to present these, but here is an example for Eider in the breeding season, showing reporting rates on a colour scale from white (zero) to orange (80%). Grey shaded areas are 10-km squares that received fewer than ten Complete Lists in the breeding season in 2020. Similar maps can be produced for winter or autumn.
Next steps
With further funding we are keen to continue developing outputs like these for bird clubs, county reports and other publications. The examples here are all for a single year. An obvious next step is to produce summaries that look across years, perhaps to reveal differences in arrival timing or increases and decreases in reporting rates. Key to this will be accounting for the differences in observer behaviour from one year to the next. This was very evident in 2020 owing to lockdown restrictions, but subtle changes in observer behaviour may be happening at other times and ideally need to be accounted for in future iterations of these summaries.
We are increasingly looking to integrate BirdTrack data with other BTO monitoring data. You can play your part by adding your bird records to BirdTrack, either as Complete Lists or as Casual Records.



Share this page